The Chemistry Behind The Formations of Different Colors of M42 Nebula

Abstract
This paper begins with the Messier 42 nebula, talking about how different color lights form due to the electron transport in Bohr’s model. How these lights are absorbed by gas and form the absorption spectrum, then how these lights are captured by sensors with the explanation between CCD and CMOS sensors. The history of spectrometer also includes plus the motivation and the reason why people are keeping doing that.
Key Words: Messier 42, Spectrum, Bohr Model, Sensor, Photoelectric effect, Spectrometer, Wavelength, Energy transform, Frequency, Coulomb’s equation
Introduction
When we were just children, sometimes laying on a green field at night the light pollution is not that bad. People lie in the starlight, and the huge Milky Way fills all of the eyesight. Surely, it is night, but when your eyes adapt to the dim, the elegant shining beauty would amaze you, indeed. Sometimes people would notice there are something different lie on the sky, something bigger with different colors. After that people who are curious about that seek for answers, Finally, they found that is called “nebula”.
The “M42”
M42 or the Orion Nebula, maybe the most popular object in the Messier objects table. It is 1,344 ± 20 light years away(Bringmann, 2017). M42 is a diffuse nebula, which means it is formed ionized gases and diffuse lights with different wavelengths. Every day, there are stars forming, M42 is the closest factory of star from the planet Earth
Figure 1 The M42 Nebula From Francesco Battistella(2017)
This paper going introduce and explain the theory of how these colors were formed, how people transform light to digit, and the way people identify chemicals from light, plus its history, and why we do it with the foreword of M42.
Excitation and emission spectra
Light is an electromagnetic wave, it could transport energy, and because of its wave-particle duality, we can say photons have energy inside. In the Bohr Model, it could be easier to explain the whole thing because it is very clear without talking about the probability wave function or The Heisenberg Uncertainty.
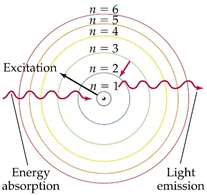
Figure 2 Bohr Model
and light (n.d.).
Retrieved June 4, 2019
As the diagram shows left, when an electron absorbs energy it would be excited, and goes outside from its ground state orbit, and it goes back to inside orbits when they release energy. The different colors of the light release directly connect to the difference of energy because the difference of colors is the result of diverse of the wavelengths, and energy relates to the frequency of the wave follows: $E=hf$
Put these two into the common equation: $v=f\lambda$ since the velocity just equal to the speed of light, which is a constant, higher frequency result in low wavelength, vice versa. So when there is an inside orbit which contain more energy because of the Coulomb’s equation: $ \int{F=\int\frac{1}{4\pi\varepsilon_0}\cdot\frac{q_1q_2}{r^2}dr}=U=-W=KE=\frac{1}{4\pi\varepsilon_0}\cdot\frac{q_1q_2}{r}$
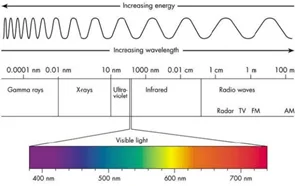
Figure 3 Wavelength, Frequency,
Spectrum and Energy From Errante, F.
As r gets smaller, the energy gets higher, so the inner orbit emits light with higher energy, which means it is in higher frequency and low wavelength result in more red light.
The forming of three main colors
There are three main colors the M42 nebula has: Red, Blue-violet, and Green.
Red light is the result of H- radiation, mainly, it talks about Hydrogen atom in Bohr’s model, the electron jump from n=3 orbit to n=2 orbit, and result in long wavelength of 656.28 nm(H-alpha Emission, 2013) which is red.
Blue-violet light is the result of massive O-Class stars radiation at the core of the nebula. By Harvard spectral classification, stars are classified to O B A F G K M from high temperature to low temperature. There is a pithy formula: “Oh Boy! A Fine Girl Kiss Me” Since O-class is hot, which means it has high energy, so O-class has high frequency and short wavelength, result in Blue-violet light.
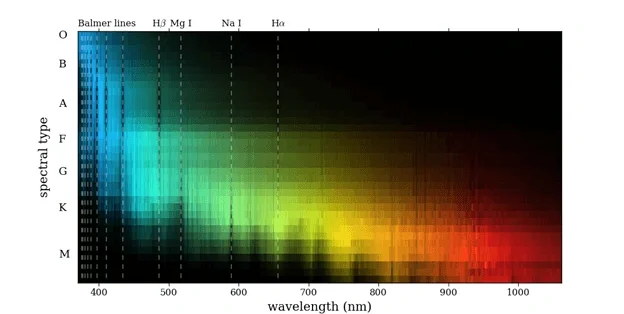
Figure 4 Star classes and wavelength from Pickles, A. J. (1998)
Green used to be mysterious in the early 20th century, because there is no known spectral lines could explain that, people even think they discovered a new element. However, by the developing of modern physics, people found the green hue is caused by the low probability transition in doubly ionized oxygen, that only could happen in the lab, but still possible happen in deep space wherein extreme condition.
Photoelectric effect: How to get a photo of a deep space object
We all know the camera could take photos, but how? Why light could be transformed to digit version, that is the contribution of the Photoelectric effect. Einstein gave the mathematical explanation for it. Mainly, if a photon carries enough energy, it could let the metal emit an electron carries with same amount kinetic energy: $KE=\frac{1}{2}mv^2$
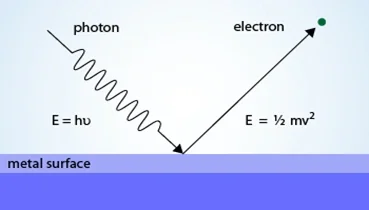
Figure 5 Axiom of Photoelectric effect
From Simple Science (2019)
Sensor Mechanism: CCD and CMOS
The sensor is where the camera accepts lights, and the place photoelectric happens. There are two main kinds of sensor exist in the market: CCD(Charge-coupled Device) and CMOS(Complementary Metal Oxide Semiconductor). The difference between these two main in the way they collecting voltage signals.
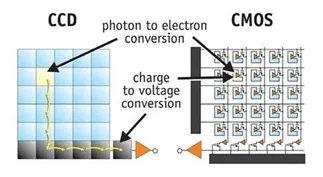
Figure 6 CCD and CMOS From Stefano
From Figure 6, each block is a pixel that the photoelectric effect happens, when there is a photo hit the pad, one electron would go out and create a voltage signal, the difference between CCD and CMOS is shows up on their signal processing mechanism. Each pixel of CCD only transform photo to electron signal then process line by line, but each pixel of CMOS could process independently.
In Astrophotography, people more like to use CCD because it would produce less noise and record faster. Heat is the main cause of useless data pixel because the heat would mess up the voltage signal, since CMOS process data on every pixel it would cause huge heat during a long time capturing which is very common in astrophotography, but it is much better on CCD because of it process data line by line. However, to minimize the noise, some people would cool down their sensor, so there is something called cooled CCD, people cool their sensors (normally 253K) to prevent noise as possible as they can.
Spectrometer: Way to identify the chemical by its emitted light
Since the different color of light it the result of different elements jump orbitals, we could inversely use this property to identify the element combination of one object. Then, the spectrometer is invented. The grating spectrometer has the clearest mechanism with the cheap prize. It could separate one combined light source to spectrum distribution just like how Figure 7 shows.
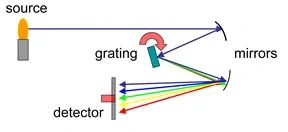
Figure 7 Spectrometer’s Mechanism
From Spectrometer(WIKI)
When a continuous light goes through a cloud, most of the spectrum would not be absorbed, but if the cloud meets the light with a certain spectrum which has the energy just enough to let its atom jump excited, the cloud would absorb it. So when people on earth observe it, they would find there are some black gaps in the continuous spectrum.
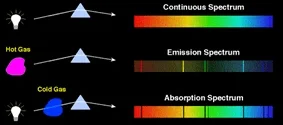
Figure 8 Spectrum’s absorption
From Anthony(2013))
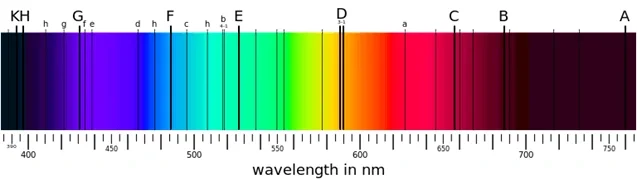
Figure 9 Spectrum’s absorption From Anthony(2013)
Take our star as an example, it is a G-class star with yellow looking. The black lines called Fraunhofer lines. Here in figure 9, for example, D-line represent element sodium, G-line is iron and calcium, C-line is $H\alpha$ …etc.
History of Spectrometer
Newton seems to be the first one who builds a spectrometer, but he did not use that to build some vital theory theories.
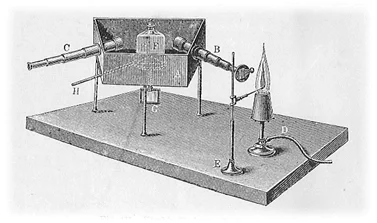
Figure 10 Spectrometer used by Kirchhoff
and Bunsen From History of spectroscopy(2019)
Bunsen invented a better flame source called Bunsen’s burner, now is common in labs and Kirchhoff designed the rest of it. Later, when Kirchhoff used this spectrometer to observe the sun, he found there are several black lines with different brightness, he guesses that might cause by different elements, then he uses some flames made by different sources to prove this hypothesis, and he finds he was right. After proven his hypothesis, he graphed 570 lines to indicate different elements.
The reason why we doing this
Using spectrometer could help us discover what made the early universe, and how the universe evolved because the nebula is the birth room of stars, it has a similar condition like the early universe
To get a better image of deep space target, know their spectrum is very important because people could choose a more suitable filter to cut off other disturbing spectra to improve the image quality.
And the mountain is there, a human being must climb it or disappear in inner dispute history.
Conclusion
M42 is a very beautiful nebula which is the closest star birth room, the light goes through the gas cloud be to absorb some with a certain wavelength, comes to earth with absorption spectrum. The light is captured by sensors(mostly CCDs), because of the photoelectric effect, it is transformed to a voltage signal, finally become digit data, processed by computer become a gorgeous image. Knowing that helps people know more about the universe and how it formed, people use this information to take a better photo by selecting more suitable filters. Human being knows the world around it a little more, exited their fundamental curiosity, which finally becomes the reason people come out of the earth but not root on it.
Reference
Bringmann, T., Conrad, J., Cornell, J. M., Dal, L. A., Edsjö, J., Farmer, B., … & Scott, P. (2017). DarkBit: a GAMBIT module for computing dark matter observables and likelihoods. The European Physical Journal C, 77(12), 831.
F. (n.d.). Retrieved from https://apod.nasa.gov/apod/ap171129.html
. A stellar spectral flux library: 1150–25000 Å. Publications of the Astronomical Society of the Pacific, 110(749), 863.
Errante, F. (n.d.). Energy and radiation wavelength. Retrieved June 5, 2019, from https://www.radiondistics.altervista.org/frequency_wavelength_energy_radiation_calculator.htm
(n.d.). Retrieved June 2, 2019, from, https://wps.prenhall.com/wps/media/objects/476/488316/ch09.html
H-alpha Emission. (2013, May 08). Retrieved June 5, 2019, from https://ismlandmarks.wordpress.com/h-alpha-emission/
Stefano, M. (n.d.). . Retrieved June 5, 2019, from http://meroli.web.cern.ch/lecture_cmos_vs_ccd_pixel_sensor.html
Anthony, S. (2013, October 02). Every color of the Sun’s rainbow: Why are there so many missing? Retrieved June 5, 2019, from https://www.extremetech.com/extreme/167878-every-color-of-the-suns-rainbow-why-are-there-so-many-missing
Spectrometer. (n.d.). Retrieved June 5, 2019, from https://zh.wikipedia.org/wiki/Spectrometer#/media/File:Spectrometer_schematic.gif
History of spectroscopy. (2019, March 04). Retrieved June 5, 2019, from https://en.wikipedia.org/wiki/History_of_spectroscopy#/media/File:Kirchhoffs_first_spectroscope.jpg